Grafana and Alerting ( Ubuntu )
Installation
Components Required
| sudo apt-get install -y apt-transport-https sudo apt-get install -y software-properties-common wget sudo wget -q -O /usr/share/keyrings/grafana.key https://apt.grafana.com/gpg.key |
Adding Repositories
| echo “deb [signed-by=/usr/share/keyrings/grafana.key] https://apt.grafana.com stable main” | sudo tee -a /etc/apt/sources.list.d/grafana.list |
Updating Packages
| sudo apt-get update |
Installing Grafana
| sudo apt-get install grafana |
Starting and enabling Grafana on startup
| sudo systemctl enable grafana-server |
sudo systemctl start grafana-server
Checking the status of Grafana server
| sudo systemctl status grafana-server |
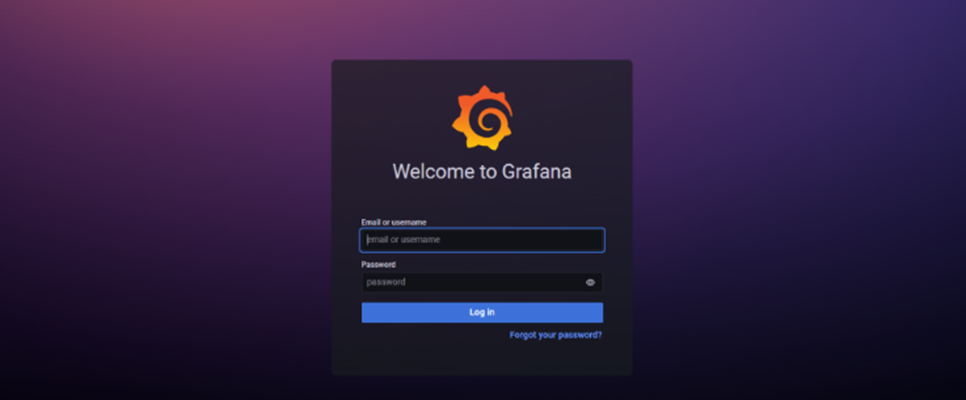
Accessing Grafana dashboard
- http://<server_IP>:3000
Dashboard View
Adding Data Source:
Inside the Dashboard of Grafana, Go to Menu Toggle, and select Data Sources
The Image below is the Data Sources view.
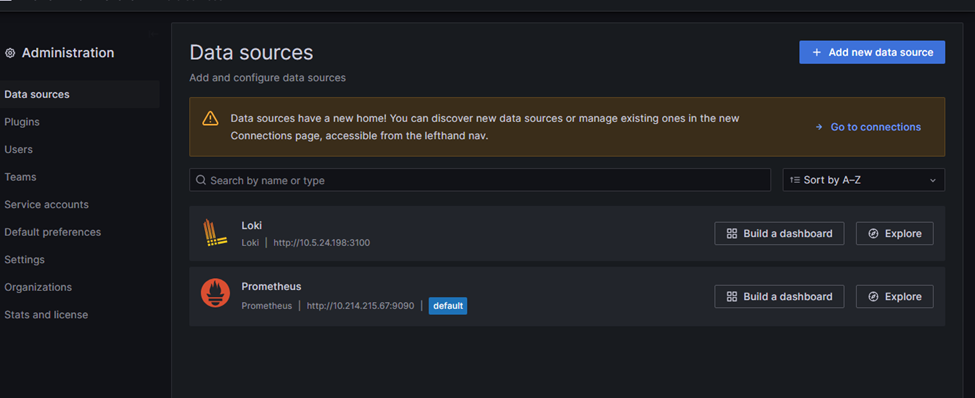
Click on add new data source and select one of the data source lists.
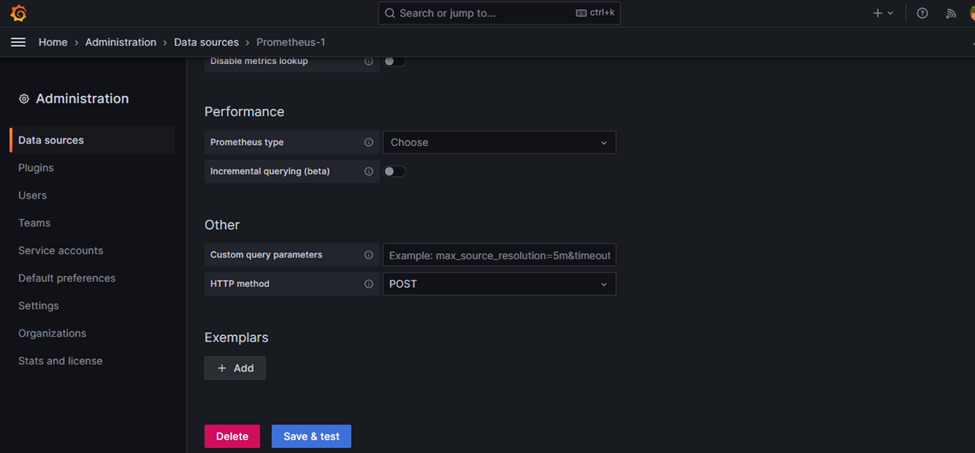
Adding Prometheus to Data Source
1. Add the Prometheus Server URL
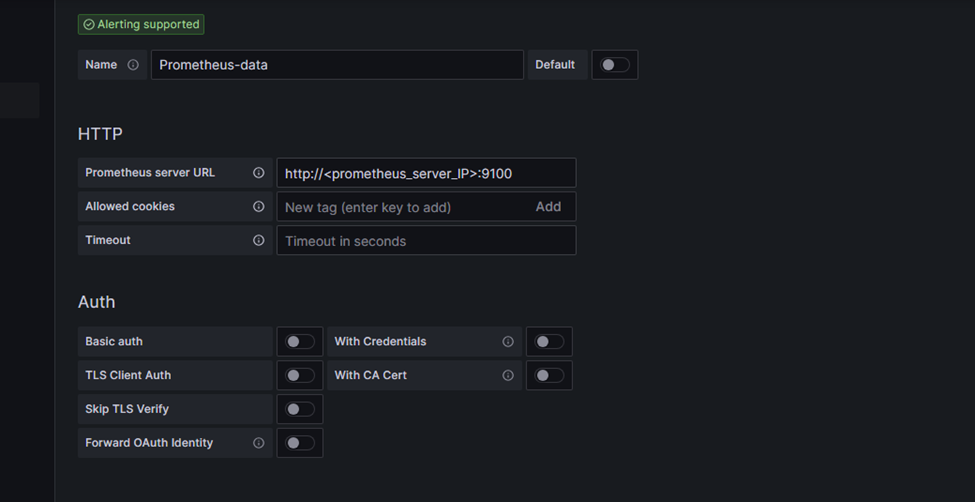
2. Click on Save & test button
If the test failed, please check the firewall on port 9100
Importing Dashboard
When creating a dashboard, the user can use import function to load the visual uploaded from grafana dashboard open-source.
Below is the link
https://grafana.com/grafana/dashboards/
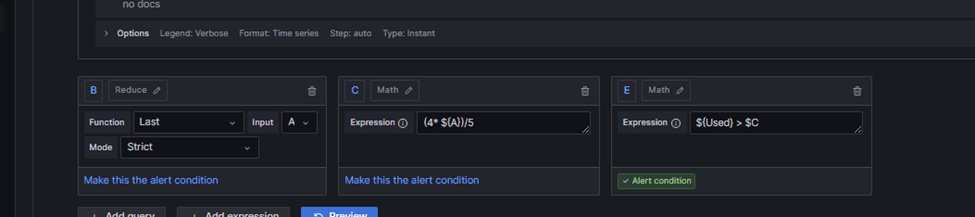
Alerting Configuration
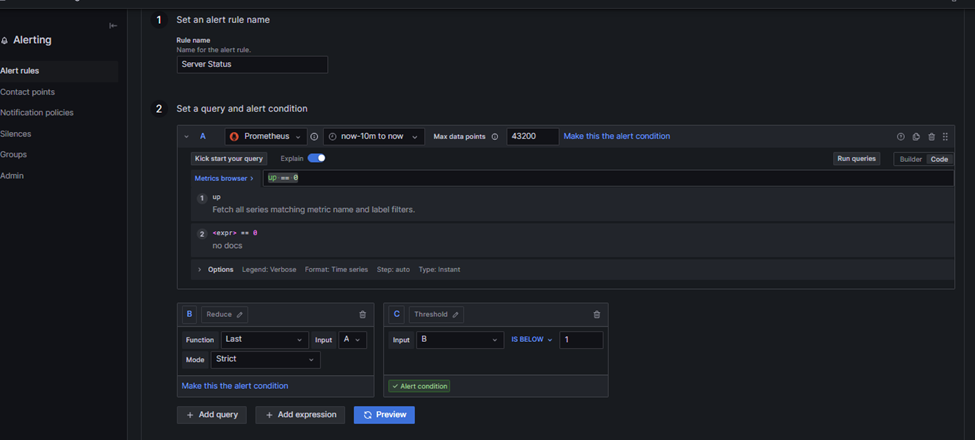
Server Status
| up == 0 |
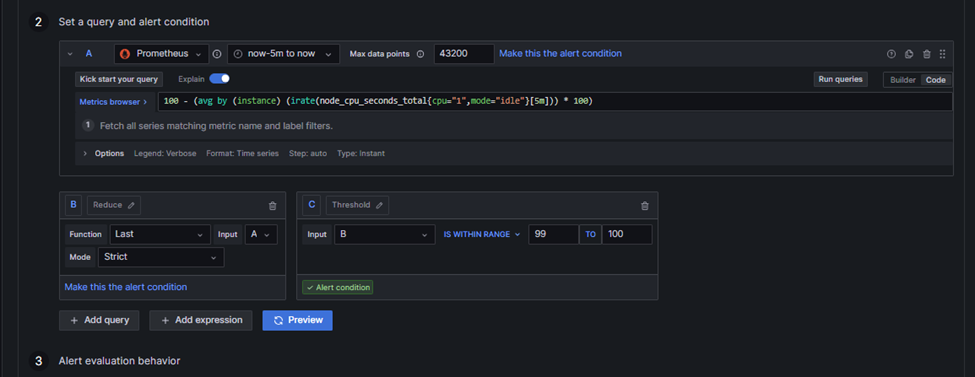
CPU Usage
| 100 – (avg by (instance) (irate(node_cpu_seconds_total{cpu=”1″,mode=”idle”}[5m])) * 100) |
Memory Usage
| (node_memory_MemTotal_bytes)/1024/1024 |
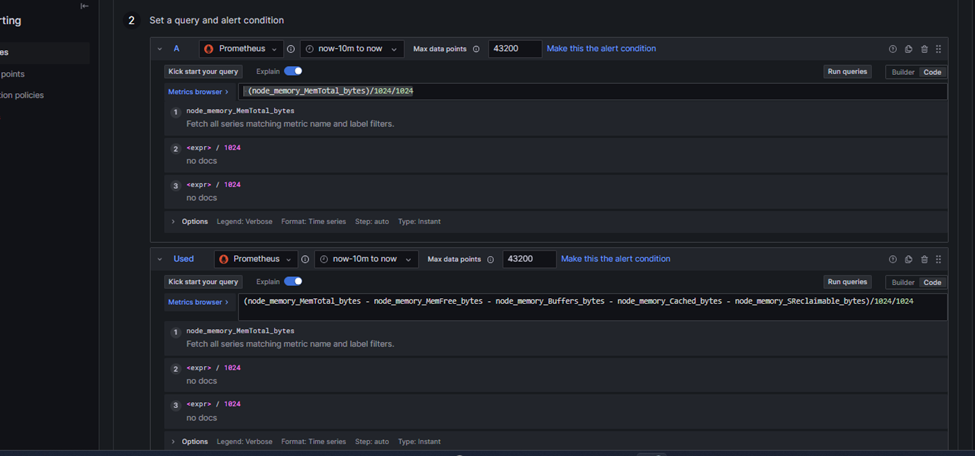
| (node_memory_MemTotal_bytes – node_memory_MemFree_bytes – node_memory_Buffers_bytes – node_memory_Cached_bytes – node_memory_SReclaimable_bytes)/1024/1024 |